Riding Through the Advertising Landscapes of NYC on the R Train
January–May 2022 | New York
Project Members: Hilary Ho, Moses Levich, Sarah Abdallah
Background
We set out to explore and document what riders of the R train encounter throughout the cars and stations of the line. The R train travels through three boroughs representing a diverse transect of New York City, including demographically distinct neighborhoods from Forest Hills to Midtown to Bay Ridge. Since advertisements are updated relatively frequently, our data represents a snapshot in time, with data collection having occurred during late winter of 2022. Our exploration resulted in the creation of a dataset and a collection of photos, which we later examined in detail.
Process
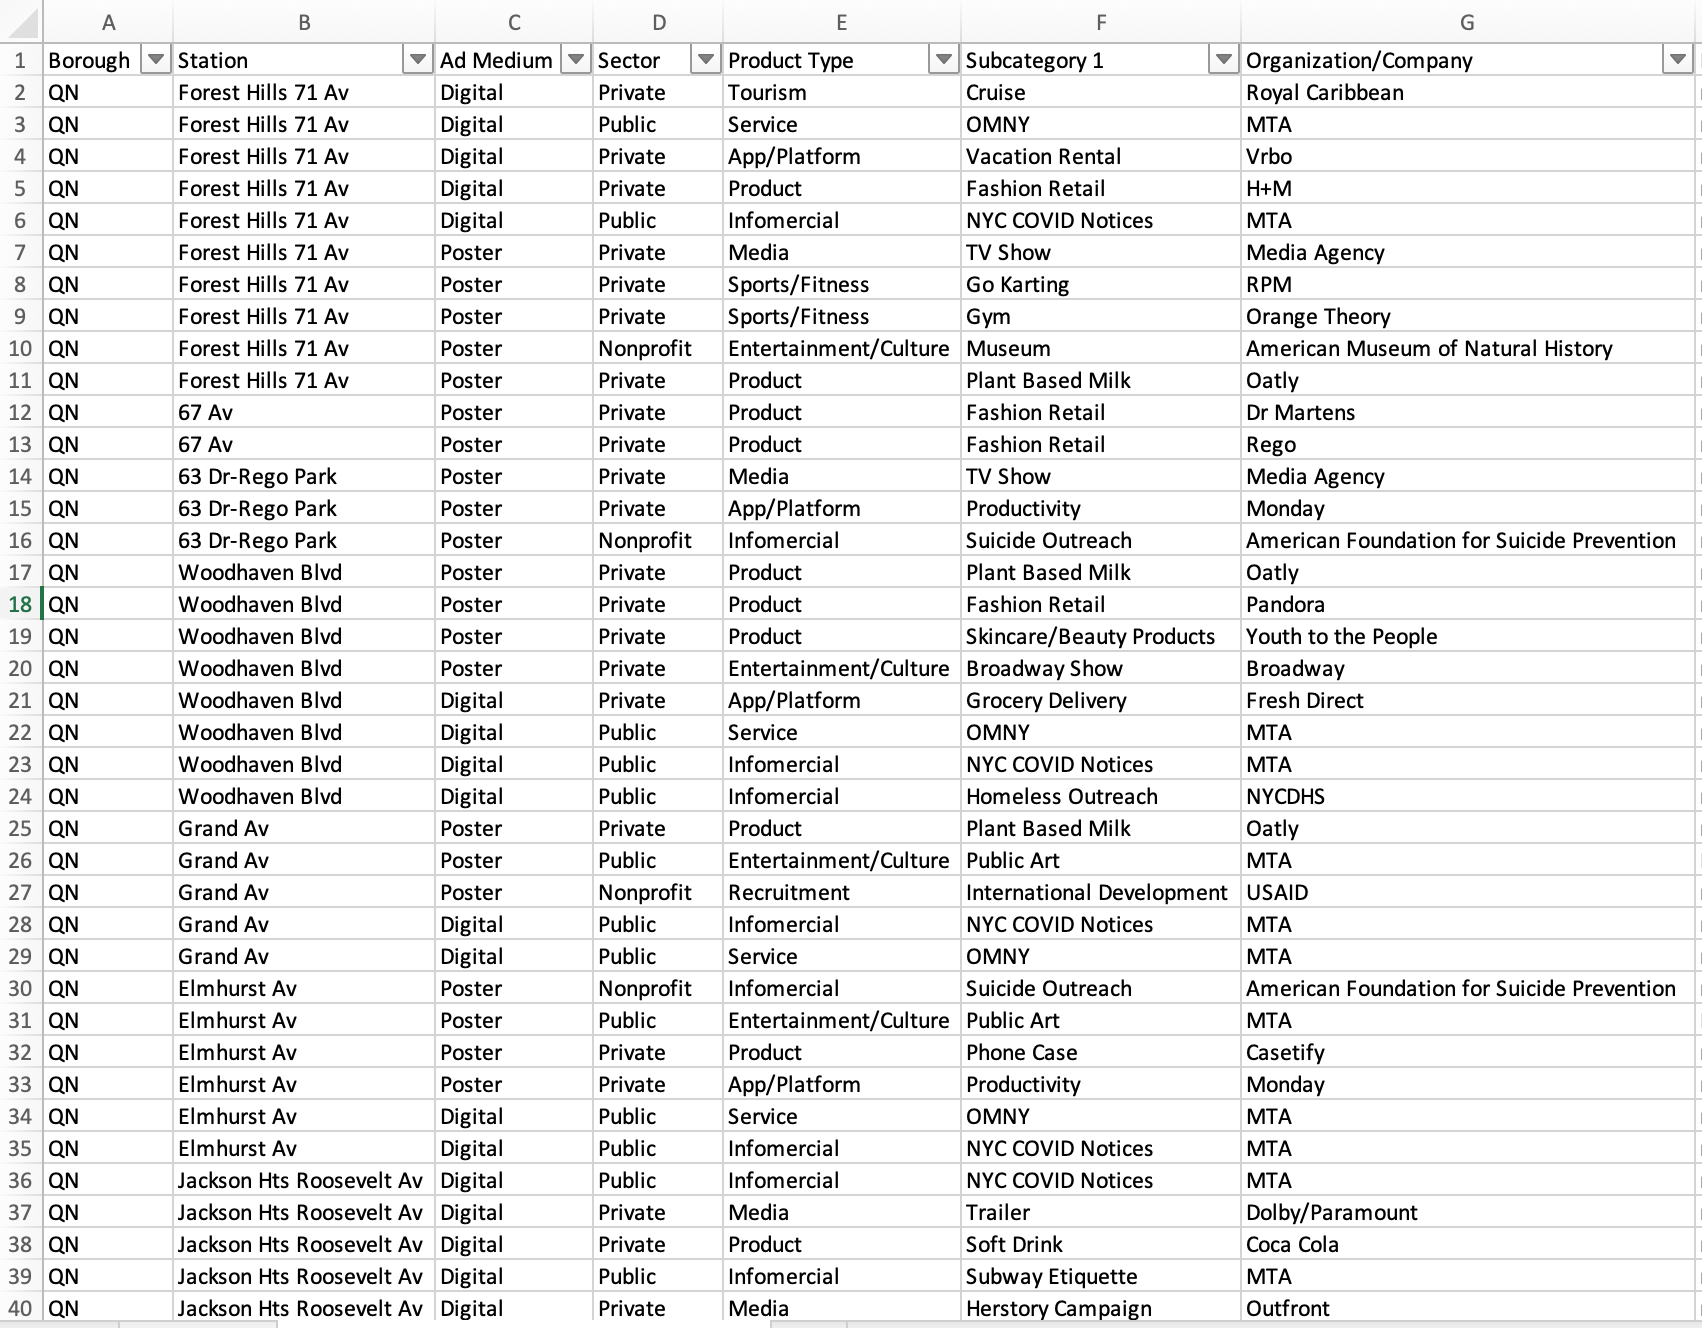
We visited every stop on the R Line from end-to-end and noted down the advertisements that we saw. From there, we compiled all our information into an spreadsheet, where each row represents an ad we saw. In total, we documented over 200 ads across the line.
From there, we categorized our data into advertising typologies by: Ad medium, Sector, Product Type, Subcategory of Product Type, and Organization.
In documenting these advertising typologies, we hope to identify larger patterns regarding the relationship between subway advertising and underlying socioeconomic characteristics by neighborhood. Advertisers choose their target demographics carefully. Can we find trends in what is being communicated to whom, and where? What are the irregularities, informal ads, vandalism, and infrapolitical communications? Are they forms of resistance?
Findings
Subway ads are tailored to their specific commuting audiences and we saw subtle changes in advertised products with increased ridership and higher scores on the gentrification index. For example, apps (specifically for food delivery, productivity, and information privacy) tended to be advertised in areas with higher ridership and higher gentrification. And as stations like Bay Ridge proves, lower ridership and lower gentrification stations tended to see fewer ads—with more of them being informercials by public agencies like the MTA—or sometimes none at all.